less than 1 minute read
Soils vary significantly across Orange County. A good example is this map of the weighted average available water content (AWC) for surface soil, which is the top layer of soil or ‘A horizon’. The three different ecoregions of Orange County and their very different AWCs are clearly visible. AWC varies by almost 3-fold in Orange County.
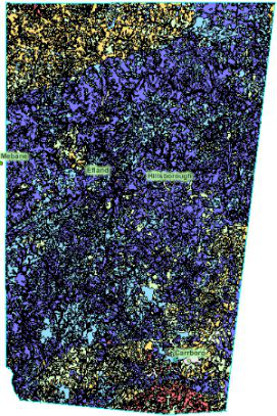
Available Water Capacity
inches per inch of soil depth
≤ 0.07
0.08 – 0.12
0.13 – 0.15
0.15 – 0.17
0.17 – 0.2
Soil Maps shows you how to access detailed maps of your property and a wealth of information on our native soils. (If your yard has been graded or filled, it may not reflect the map.) The Soils tab discusses how soil and habitat vary across the county.
![]()